Drakelow Consulting's Forecasting Tips 6-10
by Philip Stubbs
Here are more Forecasting tips, taken from my LinkedIn posts earlier this year...
Tip 6 - Understand the two forecasting approaches
There are two forecasting approaches: Extrapolative methods and Explanative methods.
Extrapolative methods only take into account historical values of the forecast variable. So if you are forecasting sales of a product, you only take into account the historical sales of that product. It treats the system as a black box. Extrapolative models include simple averages, exponential smoothing, Holt-Winters and ARIMA methods.
Explanative methods take into account the relationship between the forecast variable and other factors, where you believe there is a causal link that can explain the variation. So you might seek to forecast the sales of a product using changes in price and/or promotional activity.
There are forecasting methods that combine these two approaches.
Whether the Extrapolative or the Explanative approach is best depends on the forecasting problem itself.
Tip 7 - Consult with the forecast user & decide on these five elements
Before you start creating forecasts for an end-user, it is important to make decisions together with the user on the following five elements:
1. Frequency
Forecasts can get out of date very quickly as more information becomes known. How frequently should the forecast be updated?
2. Handover
Agree the handover date/time of the forecast that allows the user adequate time to process the forecast and take action. Also agree on the delivery format.
3. Data & Grouping
Which data should be forecast, and to what extent can lines of data be grouped together? For example, if there are 12 email types, does the user need to receive a
separate forecast for each email type, or just a forecast for total emails?
4. Time Unit
Are the forecasts required by the user in units of fiscal month, calendar month, week, day, or an interval of a day?
5. Horizon
How far into the future are the forecasts required?
By agreeing these elements up front, you can ensure that the needs of the forecast user are met, while making sure that time isn’t being spent on analysis that the user doesn’t need. It’s also worth reviewing these elements with the user occasionally.
Tip 8 - Meet the simplest forecasting method… the Moving Average
We start by looking at some extrapolative forecasting methods. These use only the historical data of what we are trying to forecast.
The simplest method is the Moving Average, which is the mean of a number of previous time periods (let's call it 'k'). Every time a new data point is known, the data points used to calculate the mean shifts forward by one, and a different forecast value can be calculated.
Select a smaller value of k if you would like the moving average forecast to adapt more quickly to recent changes in the historical data.
Moving Average is known as a smoothing method because it smooths out short term fluctuations in the data.
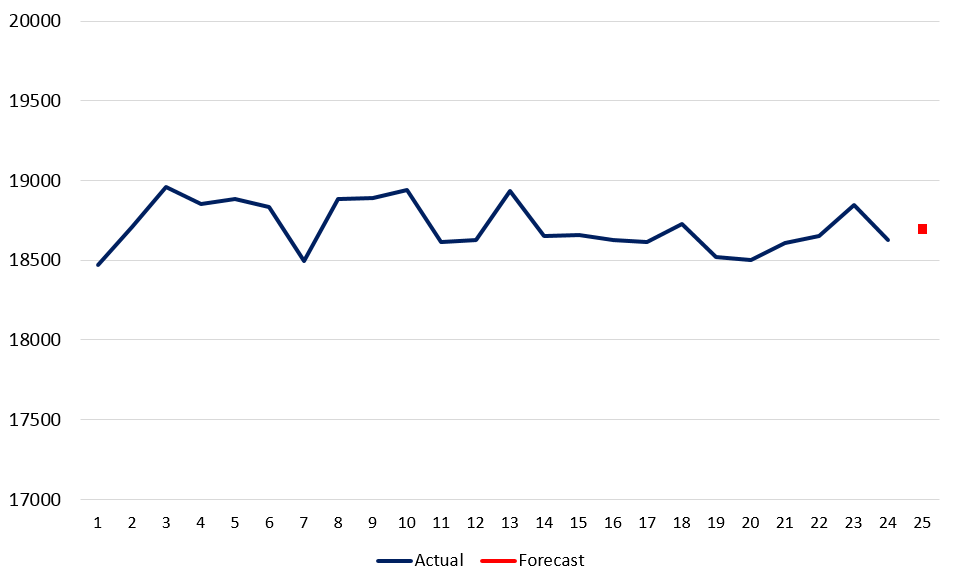
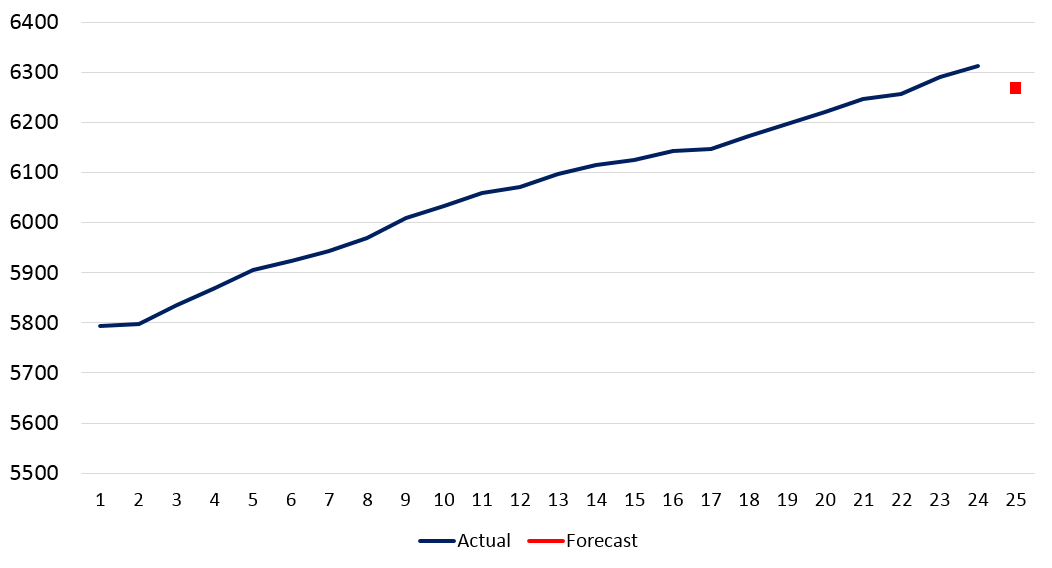
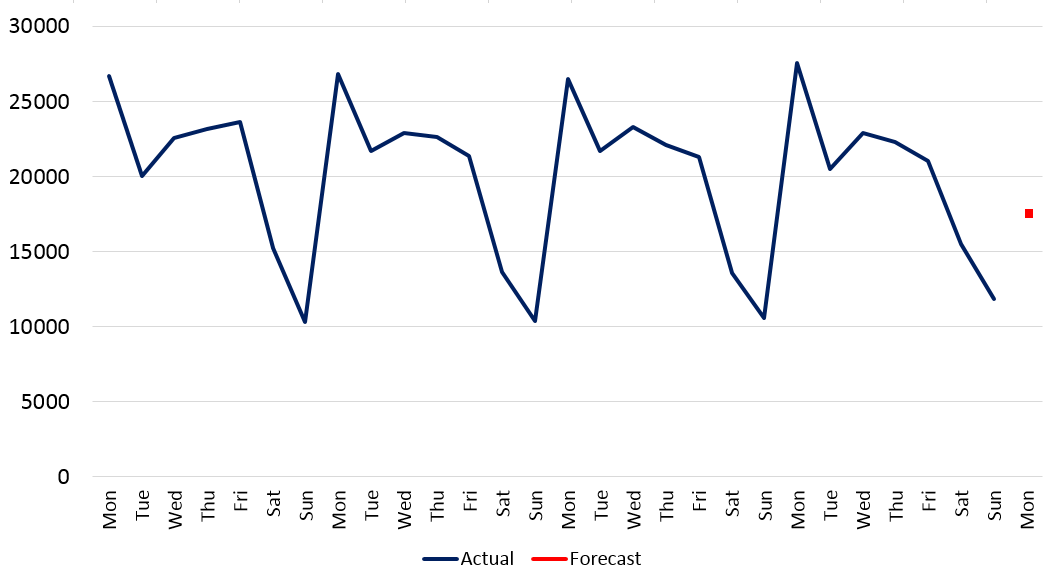
If your data has trend and/or seasonality, you should not make a forecast by calculating the mean of the last k observations. See the three examples:
Below we have weekly data with no trend and no seasonality. Using the mean of the last four values, a sensible extrapolative forecast for week 25 is 18682.

Below we have weekly data with trend. The mean of the last four data points gives 6277, which is not a good forecast if we expect the trend to continue. Calculating the mean of historical data points is not suitable here, because it doesn’t project the trend forward.

Below we have daily data with seasonality. The mean of the last four data points gives 17670, which again is not a good forecast since we should expect the seasonality to continue, ie we should expect a Monday to be around 27000. Calculating the mean of historical data points is not suitable here, because it doesn’t take into account the seasonality.

The Moving Average is a simple extrapolative technique that can be applied to data without trend and without seasonality. It gives forecasts based on the mean of recent actuals.
Tip 9 - Apply moving average to data with seasonality
In tip 8, applying the simple moving average technique to data with trend or seasonality gives poor results. This is because the mean of the last four data points does not resemble what we might expect the next observation to be.
However, Moving Average can be made to work with seasonal data in the following way.
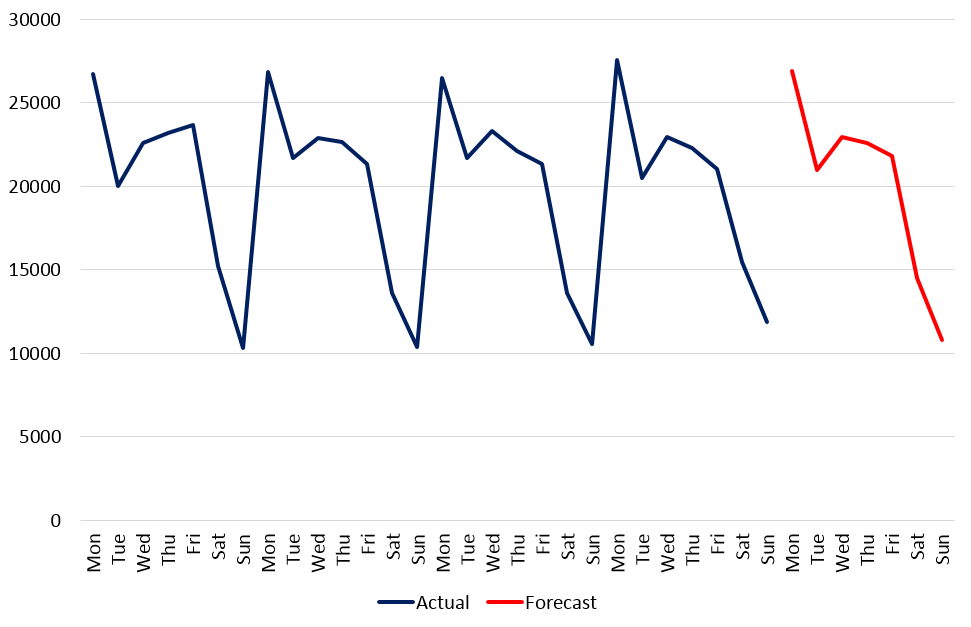
Consider the example data below. It is four weeks of daily inbound call volume data with a weekly seasonality.

Here, the forecast (in red) for Monday has been calculated as the mean of the last four Mondays. The average for Tuesday has been calculated as the mean of the last four Tuesdays. And so on.
If you expect the daily call volumes next week to resemble the previous four weeks, then applying the Moving Average to seasonal data in this way this method gives a reasonable forecast.
Tip 10 - Try a Weighted Average
In the last two tips, we have looked at calculating a forecast by finding the mean of the last k observations. As an example, calculating the mean of 4 observations is performed by summing the data points, and then dividing by 4. This is the same as performing the following calculation:
0.25*X4 + 0.25*X3 + 0.25*X2 + 0.25*X1
Where X1 is the most recent historical observation, and X2 is the observation before that (and so on). In this calculation, we are giving equal weighting to each of the last four data points.
But what if we want to give more weighting to the most recent data point? We might then have:
0.1*X4 + 0.2*X3 + 0.3*X2+ 0.4*X1
This means that we are giving a weighting of 0.4 to the most recent observation, and a weighting of 0.1 to the fourth nearest historical data point.
Consider this example:
Week 21 = 23762
Week 22 = 23105
Week 23 = 24601
Week 24 = 24104
Week 25 forecast based on simple average:
(23762+23105+24601+24104) / 4 = 23893
Week 25 forecast based on a weighted average:
0.1*23762 + 0.2*23105 + 0.3*24601 + 0.4*24104 = 24019
The rule for setting these weightings is that they must sum to one, no matter how many historical data points are used.
So try a Weighted Average if you would like to give more significance to more recent data points.
More catch-up tips will be published here soon.
Drakelow Consulting offers full support to business wishing to improve their forecasting and planning capability, including improving data, models and processes. We can also provide tailored coaching and training to ensure your analysis teams have the skills and experience required to deliver the accuracy you desire.
If you would like to discuss how to improve the accuracy and usefulness of your forecasting, across any or all of these fundamentals, then please contact us at hello@drakelowconsulting.com
